
What is the distribution of FBA – FBM in individual Amazon categories? We took a look at the categories and analyzed distribution of FBA vs. FBM.
FBA vs. FBM
If you want to sell your products as a merchant / seller on Amazon, there is always the same question:
“Do I sell my products as an Amazon marketplace merchant and handle shipment of goods, etc. myself“ or
“Do I sell my products through Amazon FBA (shipping via Amazon) and use the fulfillment service by Amazon.“
There are pros and cons for sellers to both options. In this article, we want to give you a brief overview of the distribution between FBA and FBM in the individual categories.
FBA vs. FBM – Overview by categories
With our AMALYZE Research Tool, we took a look at the distribution between FBA vs. FBM in all main categories on Amazon.de and provide you with the result here. Data is based on approx. 1.8 million products (ASINs) that are currently in our monitoring. Categories such as Amazon video, apps & games, and MP3 downloads were not included.

Distribution of FBA – FBM by categories on Amazon.de
| Category | FBA percentage | FBM percentage |
| Books | 98,30% | 1,70% |
| Foreign-language Books | 97,40% | 2,60% |
| Music – CDs & Vinyl | 96,20% | 3,80% |
| Gift Cards | 95,30% | 4,70% |
| DVD & Blu-ray | 90,70% | 9,30% |
| Suitcases, Backpacks & Bags | 59,80% | 40,20% |
| Watches | 59,00% | 41,00% |
| Sport & Recreation | 48,10% | 51,90% |
| Pharmacy, Health & Body Care | 46,90% | 53,10% |
| Office & Writing Supplies | 44,80% | 55,20% |
| Musical Instruments & DJ Equipment | 43,30% | 56,70% |
| Beauty | 42,60% | 57,40% |
| Clothes | 42,50% | 57,50% |
| Games | 41,40% | 58,60% |
| Trade, Industry & Science | 41,20% | 58,80% |
| Food & Drink | 41,20% | 58,80% |
| Software | 40,60% | 59,40% |
| Baby | 39,80% | 60,20% |
| Shoes & Handbags | 39,80% | 60,20% |
| Lighting | 38,90% | 61,10% |
| Pets | 38,70% | 61,30% |
| Large Electrical Appliances | 36,50% | 63,50% |
| Kindle Shop | 36,50% | 63,50% |
| Jewelry | 36,10% | 63,90% |
| Construction | 35,70% | 64,30% |
| Toys | 33,90% | 66,10% |
| Garden | 33,20% | 66,80% |
| Other | 32,20% | 67,80% |
| Newspapers | 27,00% | 73,00% |
| Computer & Accessories | 26,50% | 73,50% |
| Kitchen & Household | 24,10% | 75,90% |
| Car & Motorcycle | 22,40% | 77,60% |
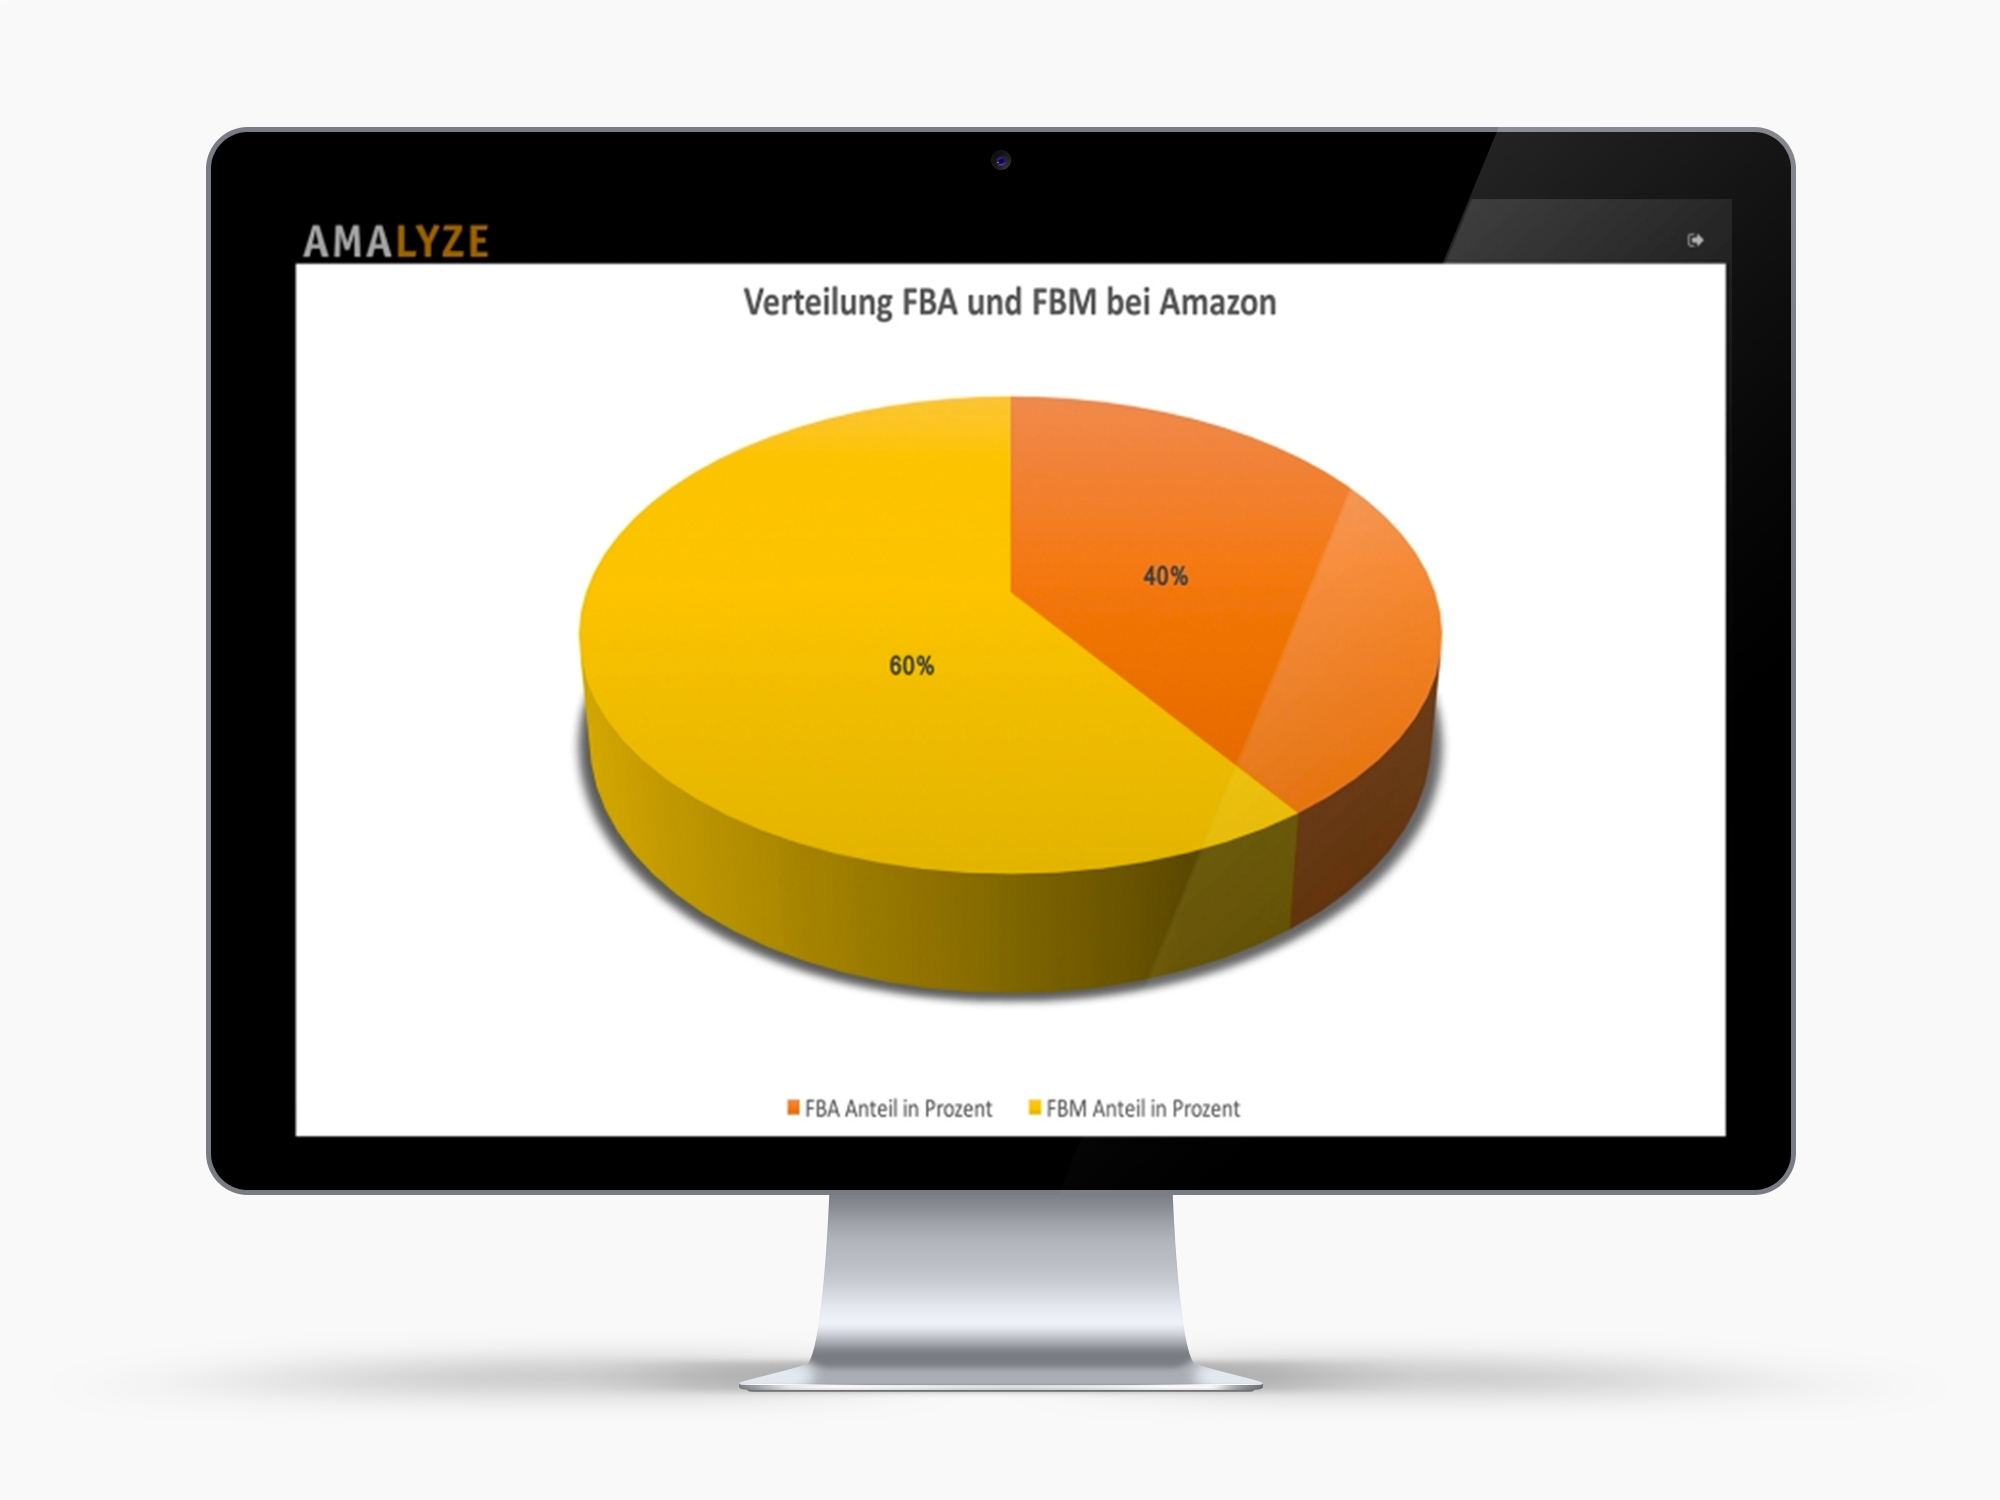
| Total | 40,20% | 59,80% |
Distribution of FBA vs. FBM by category on Amazon.de
From a bird’s eye view of all Amazon categories, you realize that not even half of all products (1.8 million products as of 11/16/2016) are sold via Amazon FBA.
FBA 40.2 % vs. FBM 59.8 %.
In several categories, “Car & Motorcycle”, “Computer & Accessories”, and “Kitchen & Household”, the percentage of FBA is even below 30 %.
| Category | FBA percentage | FBM percentage |
| Car & Motorcycle | 22,40% | 77,60% |
| Computer & Accessories | 26,50% | 73,50% |
| Kitchen & Household | 24,10% | 75,90% |
On the other hand, there are categories in which the percentage of FBA products is above average. This is mainly on account of Amazon being extremely well represented in these categories or absolutely dominating them.
| Category | FBA percentage | FBM percentage | Amazon is at x% in the buybox: |
| Books | 98,30% | 1,70% | 98% |
| Foreign-language Books | 97,40% | 2,60% | 95% |
| Music – CDs & Vinyl | 96,20% | 3,80% | 92% |
| Gift Cards | 95,30% | 4,70% | 100% |
| DVD & Blu-ray | 90,70% | 9,30% | 80% |
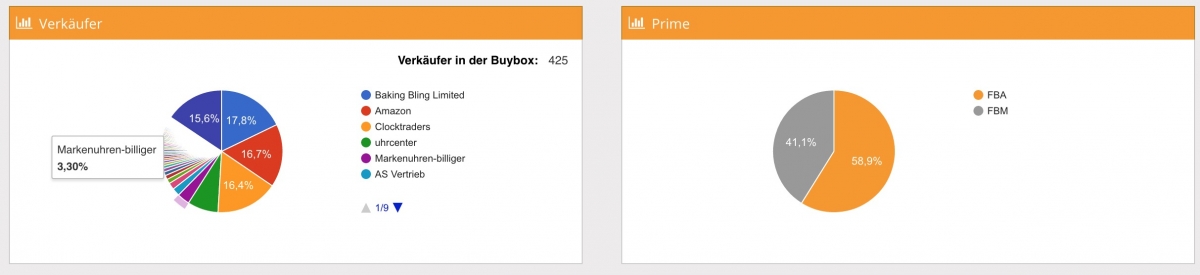
The only two categories with an FBA percentage greater than 50% that are not dominated by Amazon are “Suitcases, Backpacks & Bags” and “Watches”.
Distribution in the category – “Suitcases, Backpacks & Bags”

Distribution in the category – “Watches”
Development of Amazon FBA
In 2013, the number of active marketplace sellers that use Amazon FBA rose by more than 65% globally, additionally, the number of FBA items shipped worldwide during the Christmas shopping season increased by more than 50% in comparison to the prior year.
In the Christmas shopping season of 2014, over 10 million Amazon customers worldwide used Amazon PRIME for the first time.
In 2015, already more than 40% of all items sold on Amazon were ordered through external sellers, and that number is on the rise.
(Source: https://services.amazon.de/)
Overview of pros and cons of Amazon FBA
Pros
- You don’t have to keep your own warehouse
- Returns are handled by Amazon
- Amazon takes on product packaging and shipping
- Prime logo – better visibility of products
- No shipping costs for customers
- Amazon handles customer service
- Better shipping costs (through Amazon prices)
Cons
- Orders are consistently processed by Amazon, you no longer have any control
- Reconciliation with your own inventory control system
- Packages show Amazon logo, not your own
- Costs for FBA service (fulfillment by Amazon)