
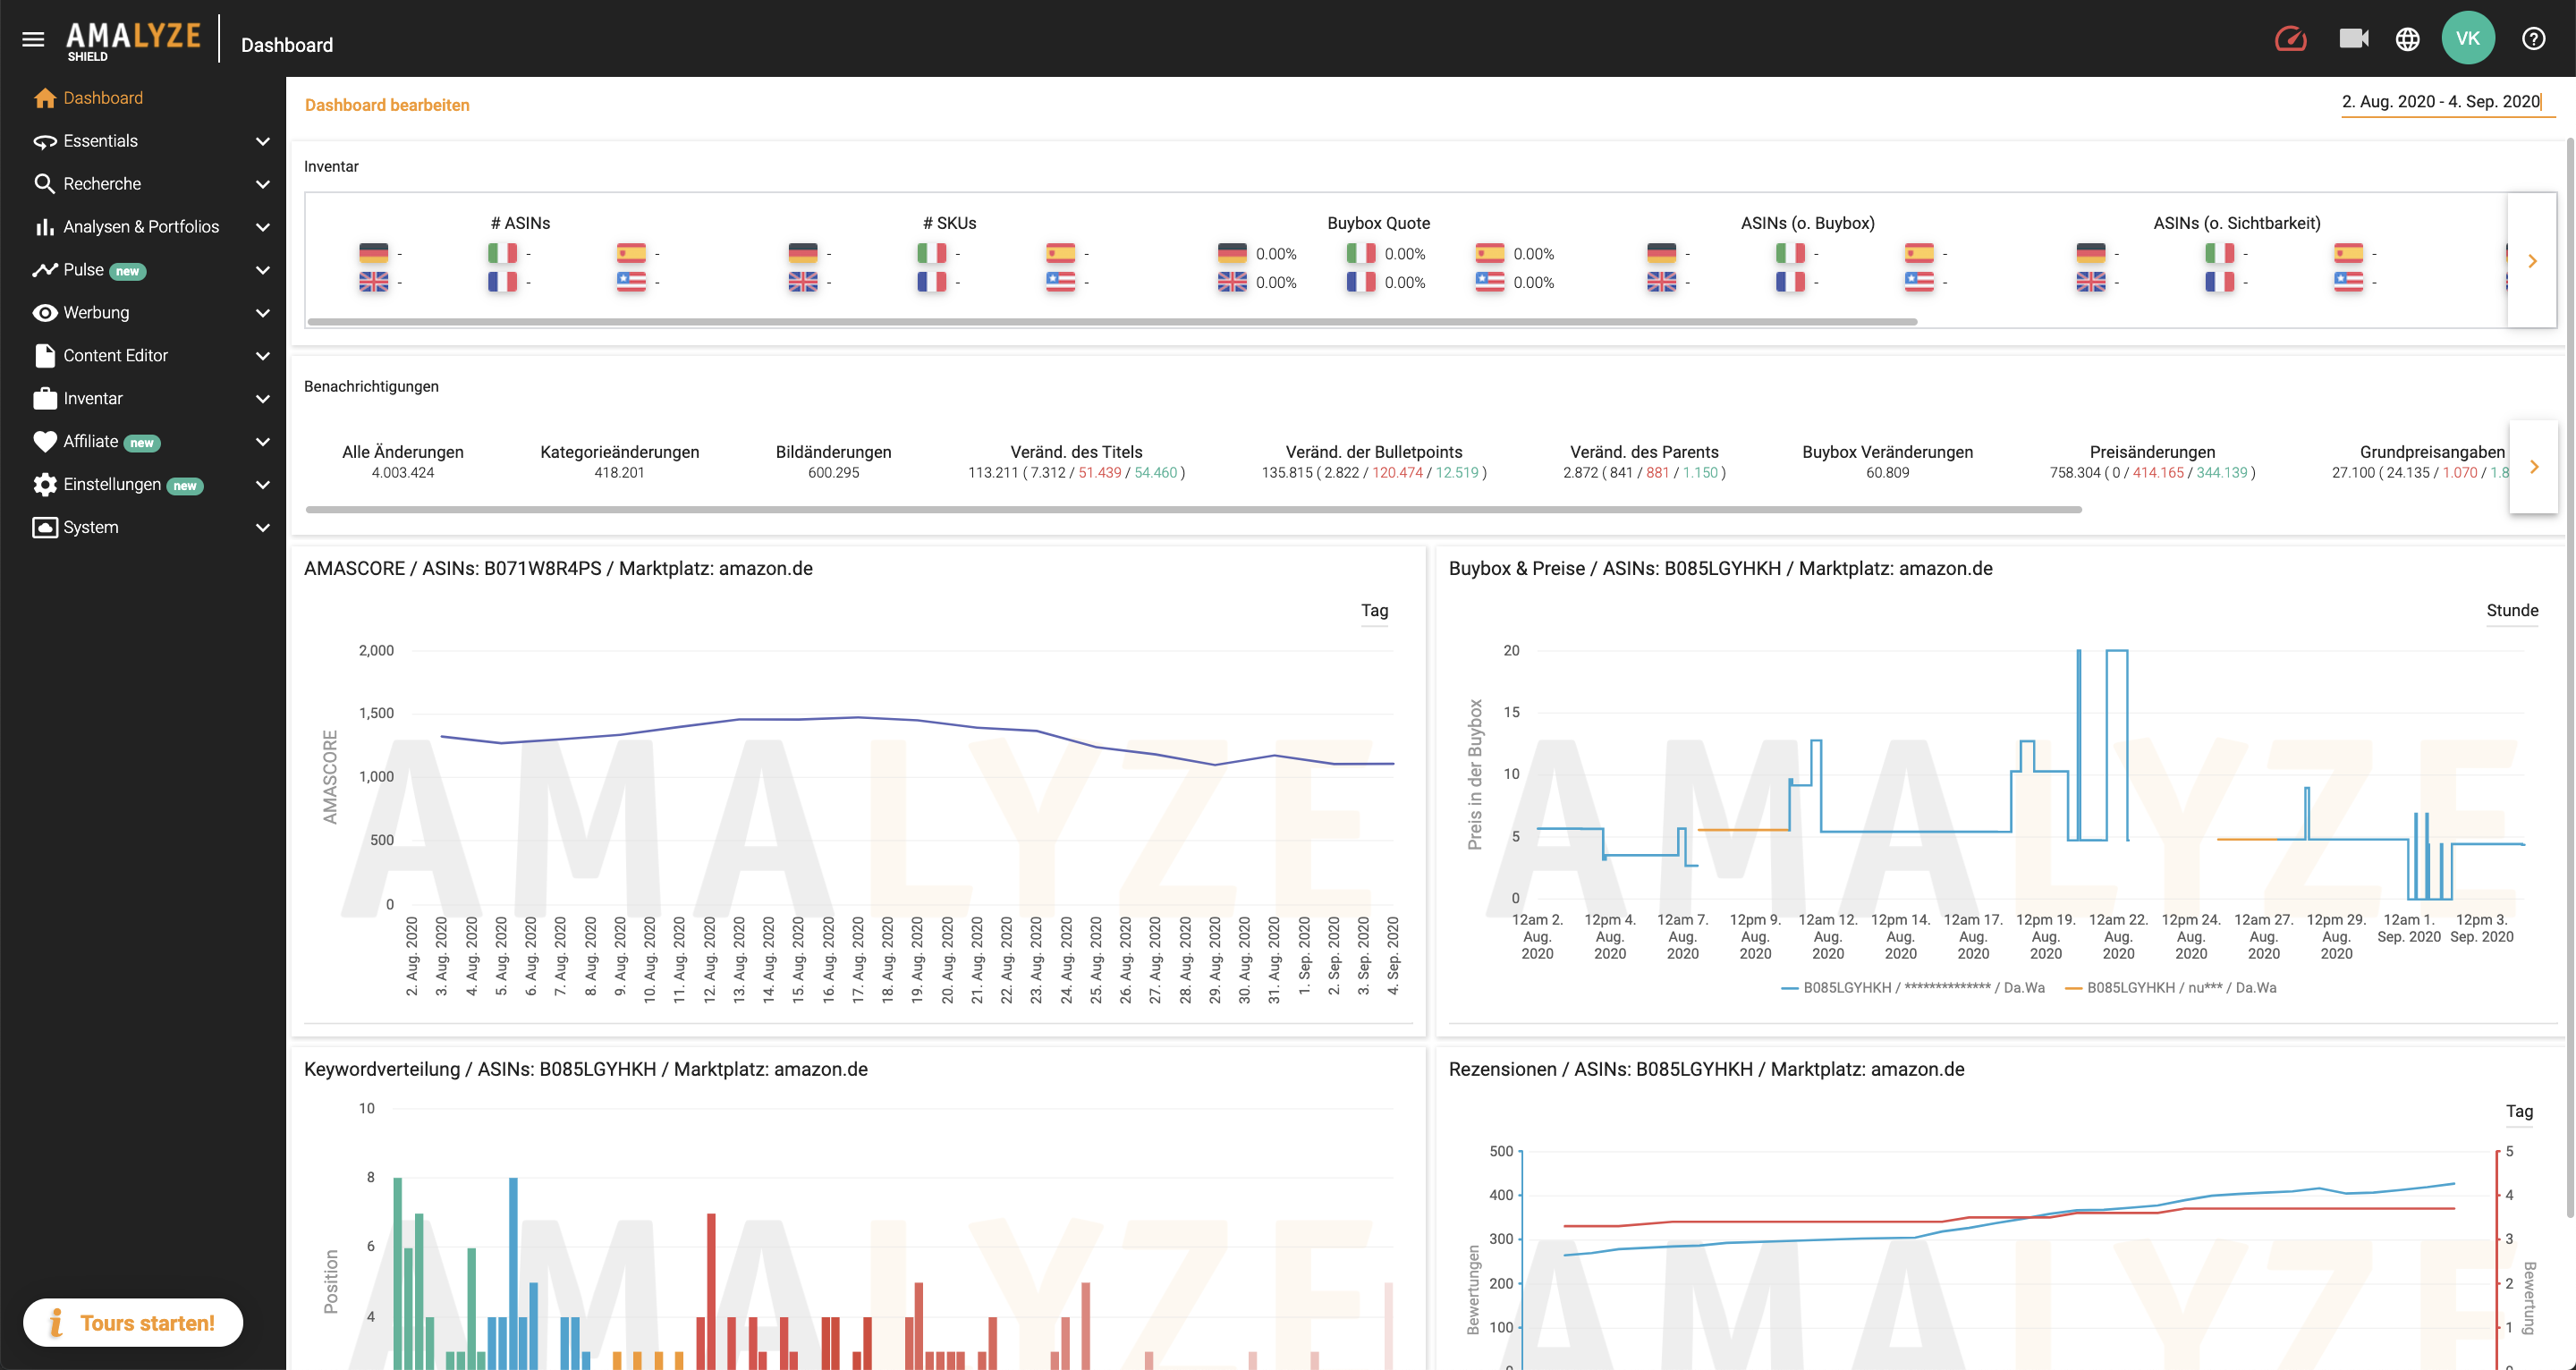
Dashboard
Your dashboard is the first page you land on after successfully logging in to AMALYZE Shield. In the environment of AMALYZE Shield you will find charts & and partly other fields, which you can put on your dashboard in the form of a widget with a few simple clicks. In addition to the charts, these include, for example, the inventory, which you can link to your Amazon account, as well as the notifications that you can create in AMALYZE Shield. The dashboard offers you a quick overview of selected information, which can also be limited in time at any time.
Clearly structured
The dashboard organizes the individual widgets in a grid-like design. This means that each widget that you place on your dashboard can be found quickly and systematically. So the clarity is guaranteed. Depending on the widget content, either half a page width or the full page width is used. However, if the content exceeds a full page width, such as an inventory widget, YOU have the option to scroll from left to right in this widget.
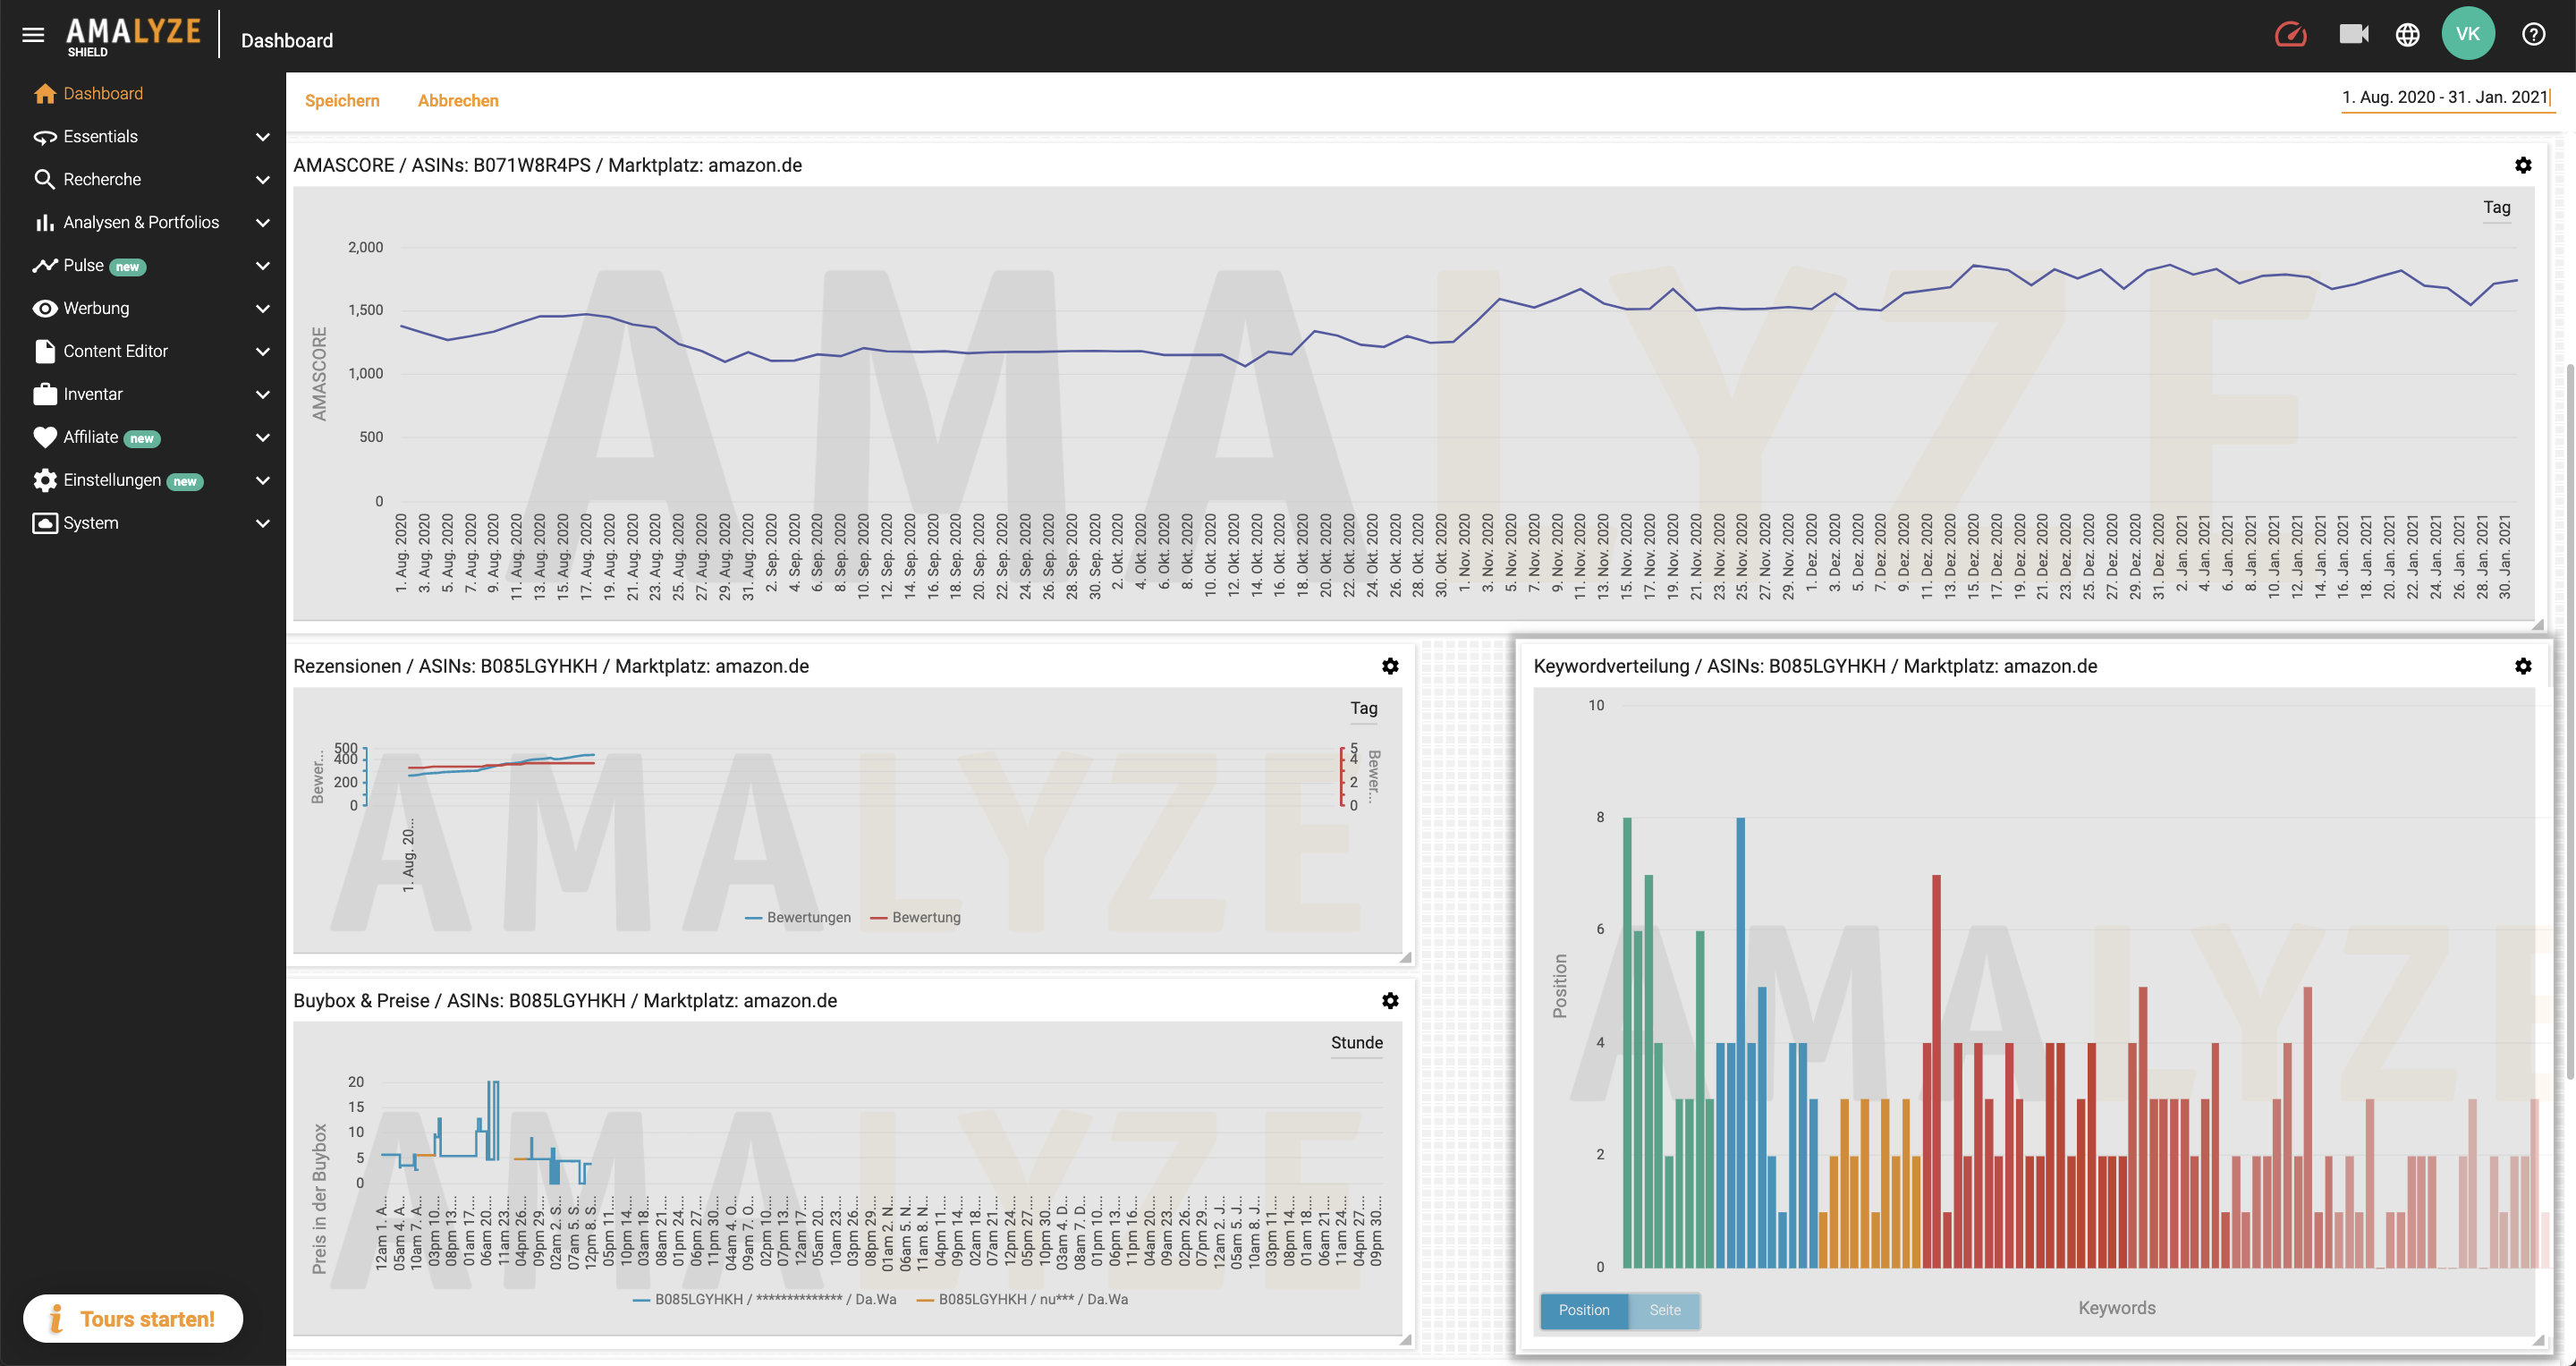
As you need it
The size and position of the widgets can be adjusted individually. If you are in the Dashboard, you will find a button with the text “Edit Dashboard” in the upper left corner. This allows you to go to the editing function. You now have the possibility to move the widgets with a simple drag-and-drop with the mouse cursor. As soon as you hover the mouse cursor to the edge of the widget, a small arrow appears. If you now click on this spot, you can change the size of the widget in the axis of the arrow by “dragging” it back and forth.
Customizable time frame
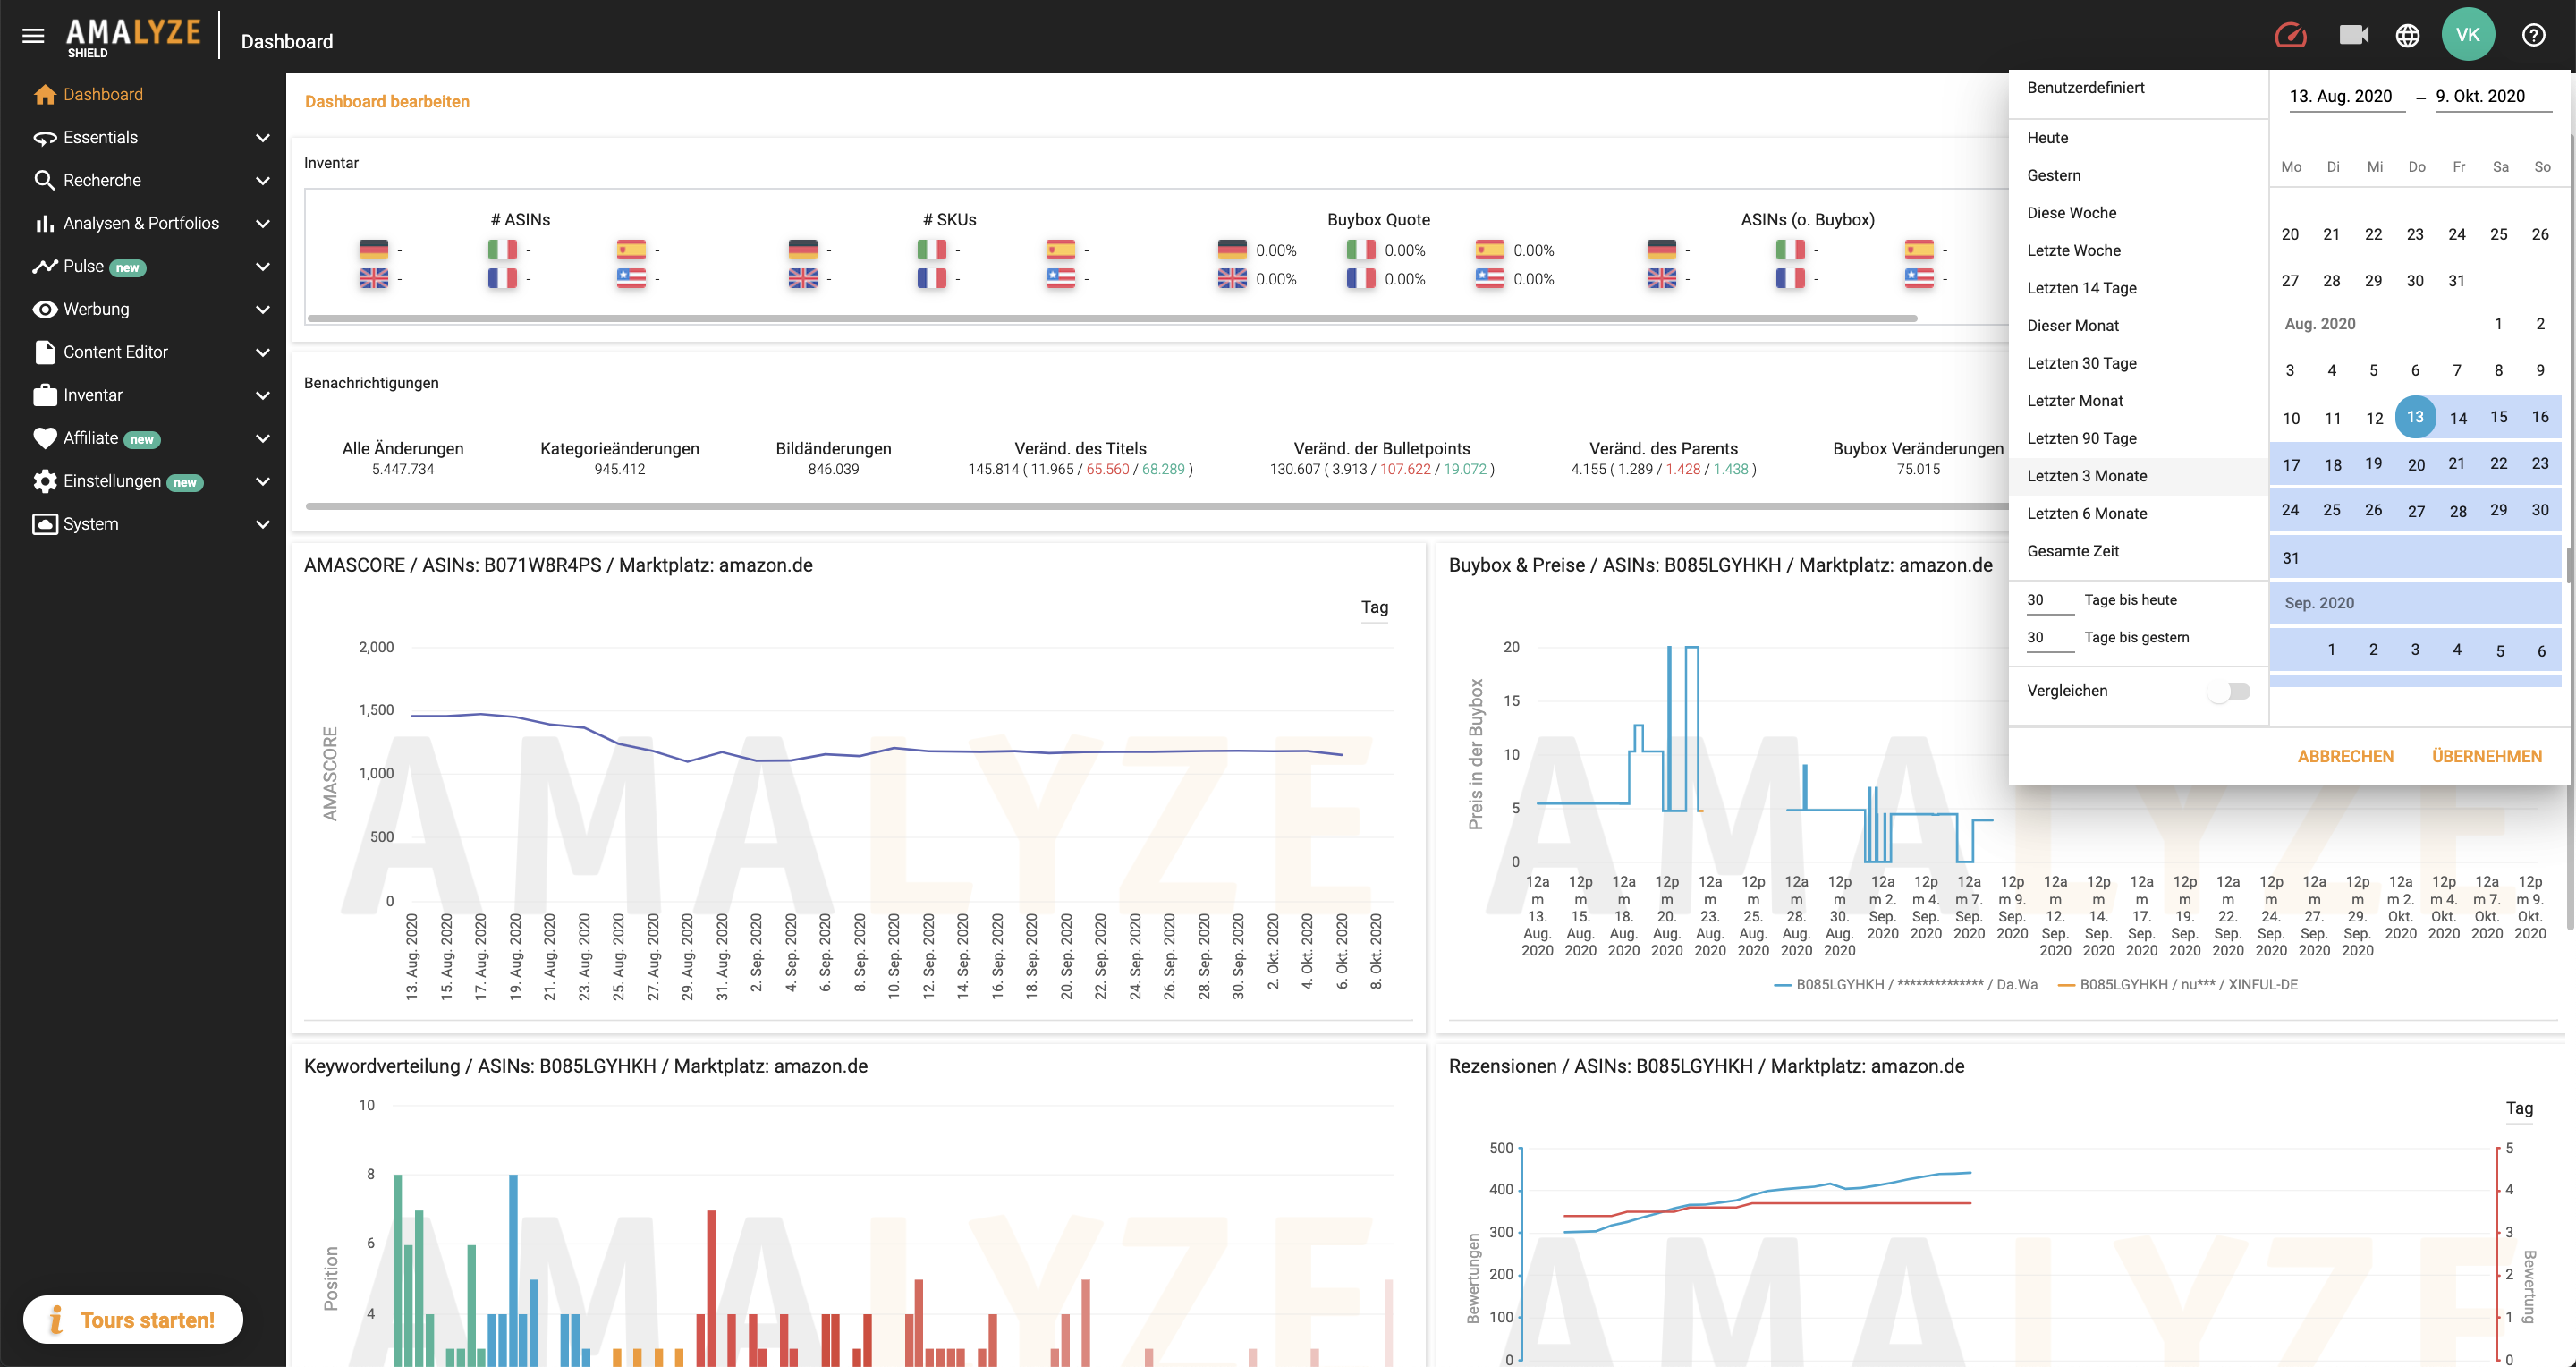
The “ACTUAL” time is often of no use if you don’t know how it was before. Has something changed? Has something improved? Has something worsened? That’s why in many cases, we also display historical values within AMALYZE Shield. For this purpose, there is a date selection in the upper right corner of the screen, which allows you to set an individual observation period for the available data and charts. This date selection can also be found in the dashboard. If you set a specific date, this will have an effect on all charts with historical data. You can choose between absolute time periods (e.g. 01.04.2020 – 23.01-2021) or dynamic time periods (e.g. Last week, Last 14 days, Last 6 months, total time etc.).
Where to find widgets?
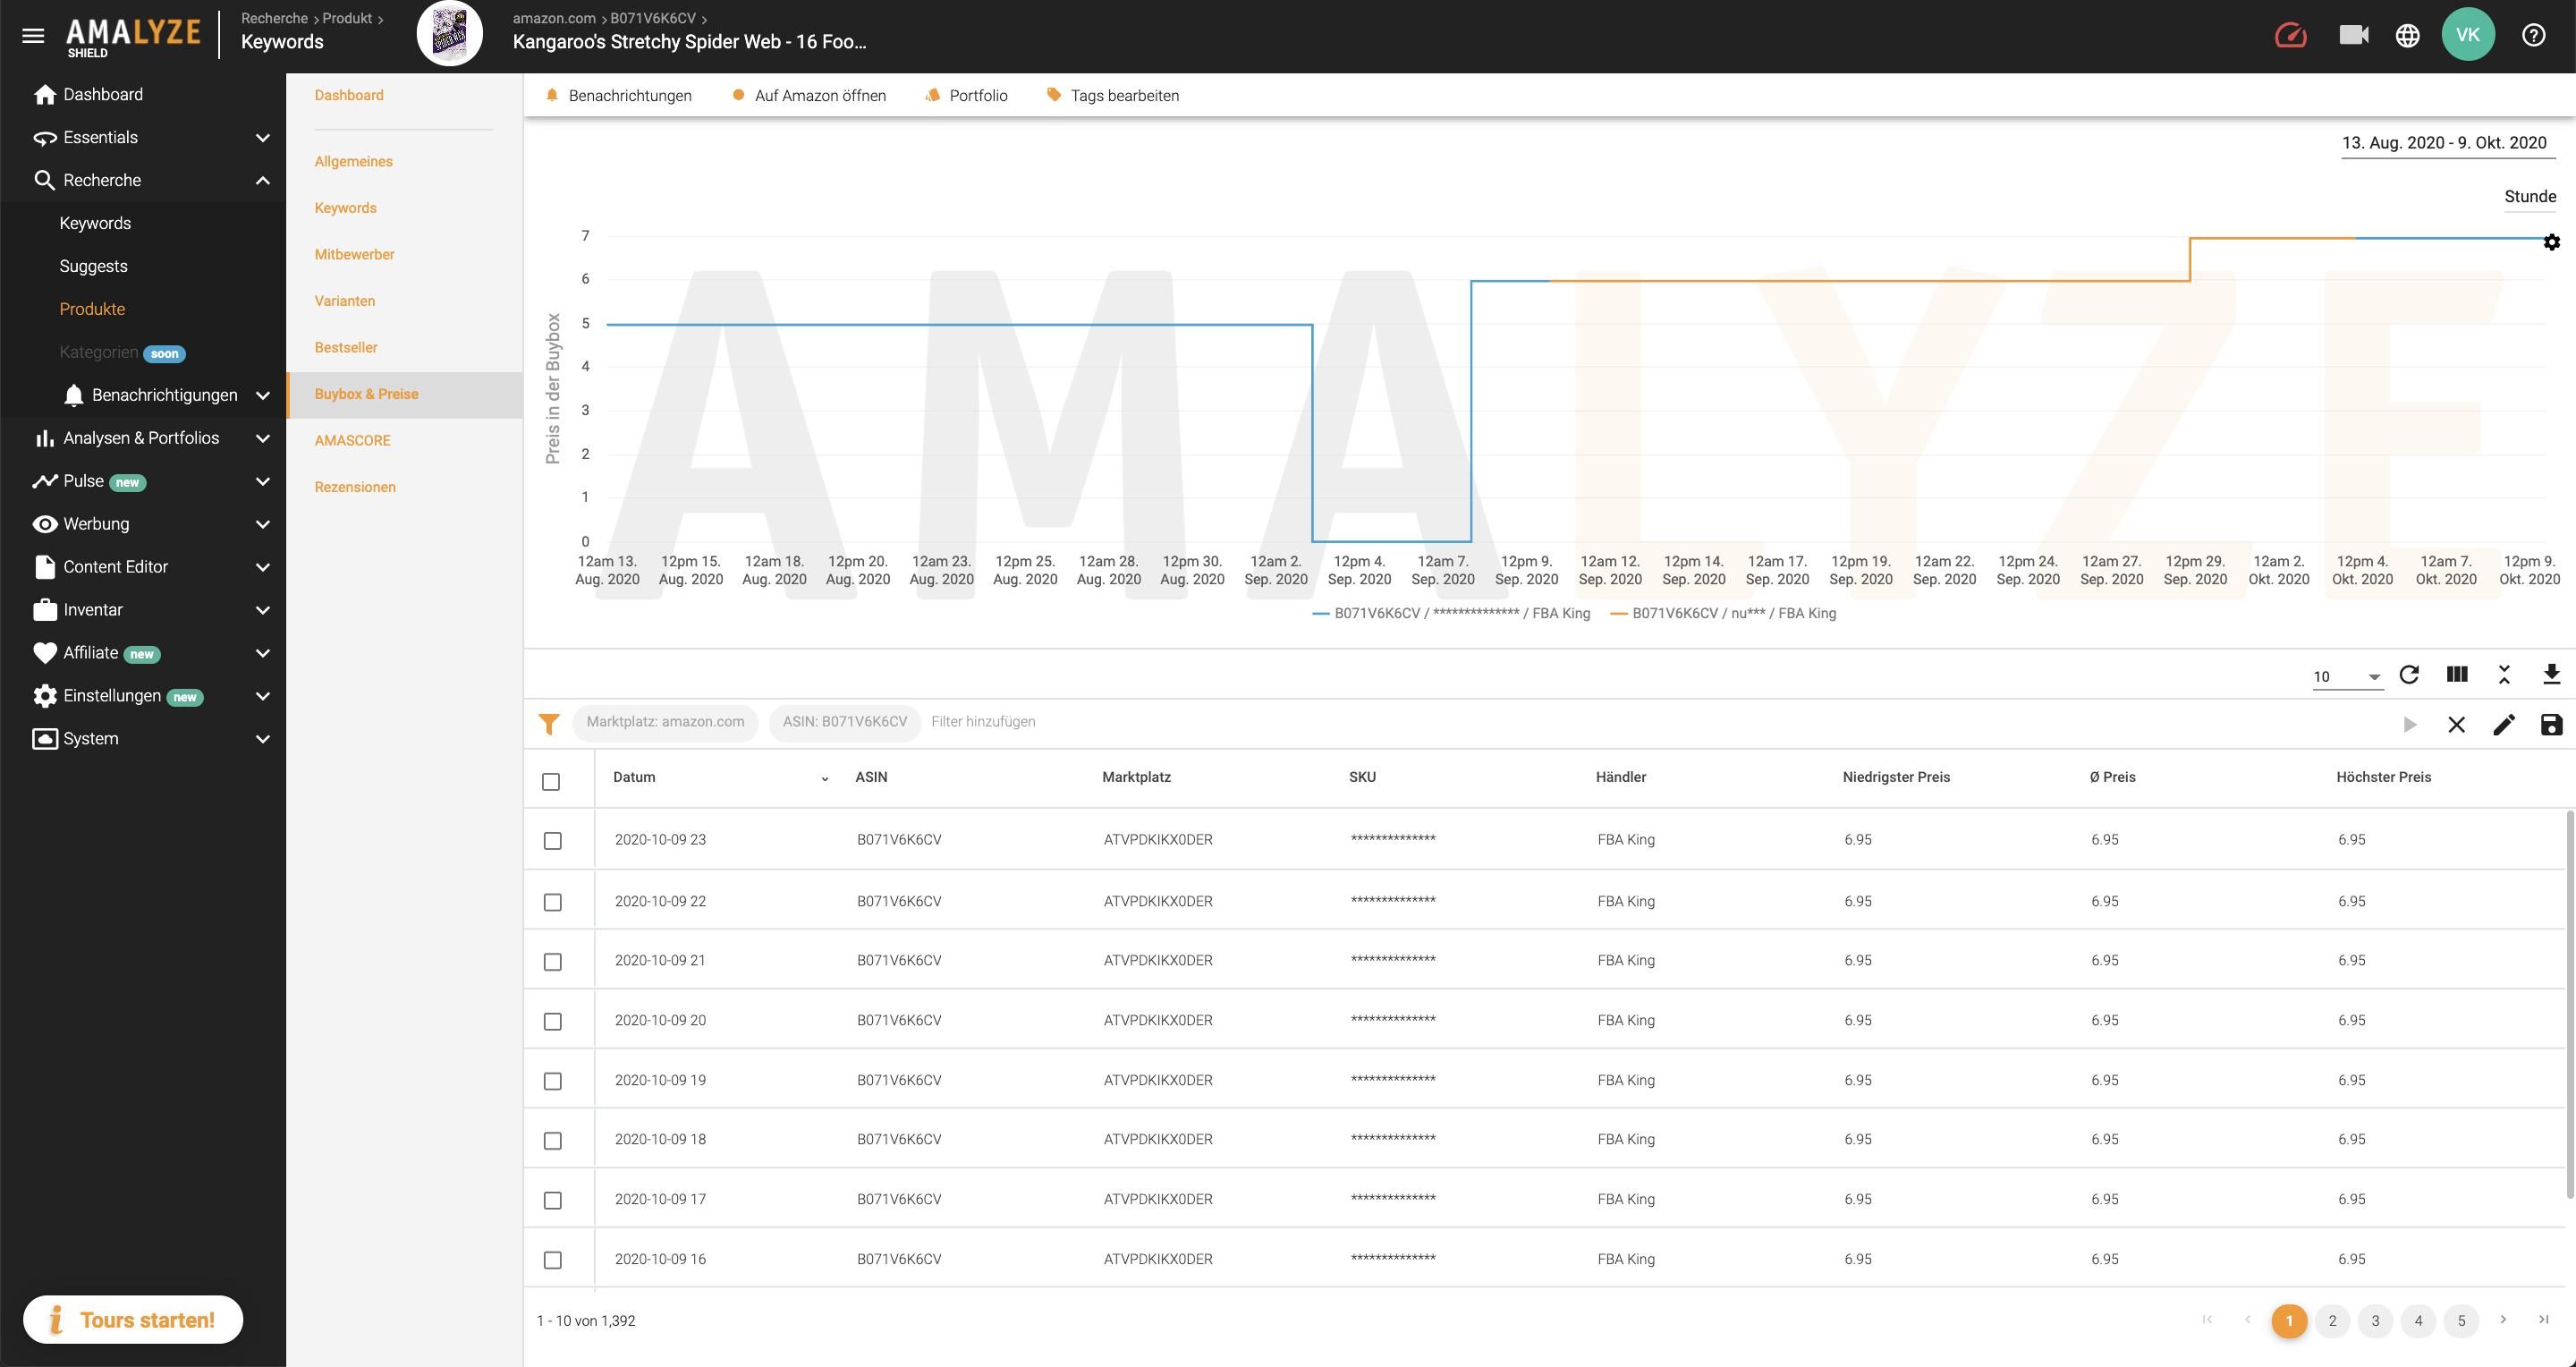
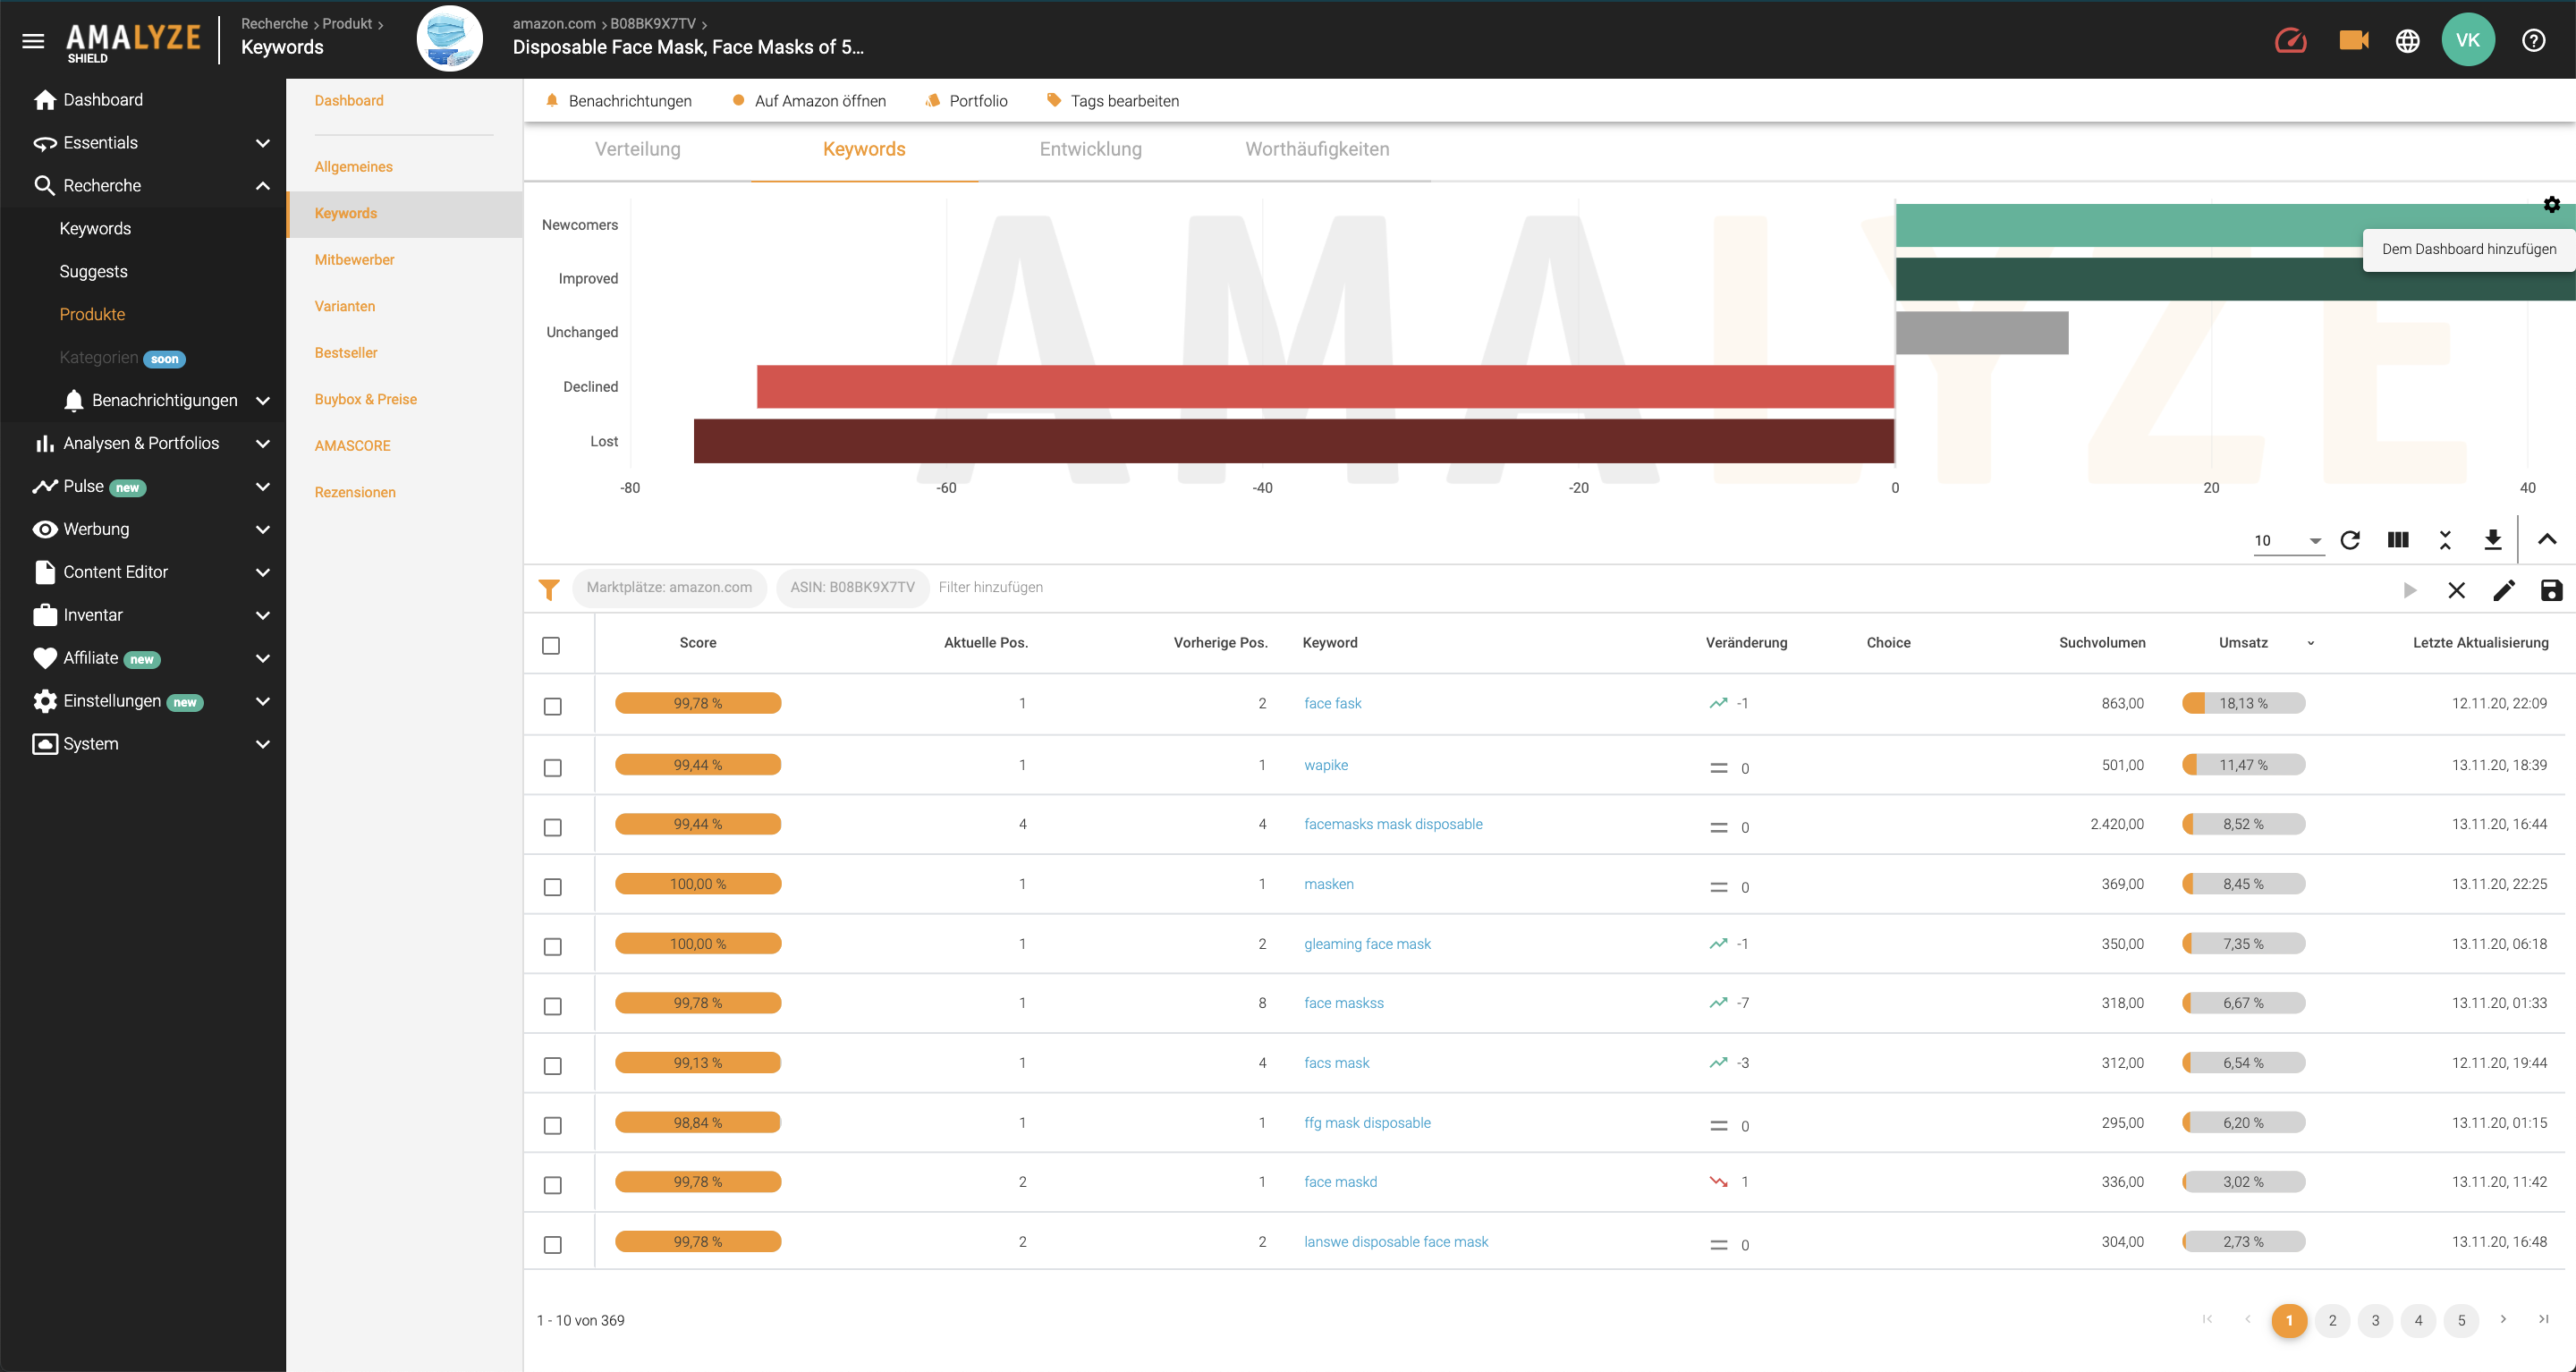
If you are within AMALYZE Shield, you will find widgets at various places. For example, if you click on an ASIN with a blue background, you will get an extended overview of this ASIN, which also offers you another menu on the left side. If you select the menu item “Keywords”, you will find a chart (see picture). In addition to charts, you will also find the inventory in the inventory overview and the notifications in the notification overview, which can also be placed on the dashboard in the form of a widget.
How do I add widgets to the dashboard?
If you have a chart in front of you in AMALYZE Shield, you will notice that there is a small clickable gear in the upper right corner. If you click on this gear wheel, a button with the inscription “Add to Dashboard” will appear. As soon as you click this button, a small window appears, which asks for your confirmation and you already have the chart in the form of a widget on your dashboard. So you will find it directly at your next login.
Need more information on AMALYZE Shield?
Here we provide more detailed information on AMALYZE Shield, the tool for five European Amazon marketplaces: display of search volume, the most relevant categories for the top 100 ranked products, selectable filters on Amazon, and ranking results for every tracked keyword.
AMALYZE Shield live presentation
Do you want to see the entire AMALYZE Tool for Amazon in action from the inside without strings attached, be guided through all basic functions and have the opportunity to ask questions? No problem: participate in a free live webinar. Follow the link to the dates.